
Pearson’s correlation (r) check the relationships between two or more variables; there are three types of correlations: simple correlations, multiple correlations, and partial correlations.
- The correlation between two variables is known as simple correlation.
- Multiple correlation is the correlation between three or more variables.
- Partial correlation – Two or more variables are involved, check the correlation between two variables other variables are control/ constant.
A linear and a non-linear correlations exist.
Assumption of the linear correlation
- Random sampling
- Independent measurements or observations
- All variables should be normally distributed.
- Measurements are continuous scale
- The first steps of the correlation analysis is make a scatter plot diagram.
- Dependency of the variables – Measure the strength of a linear relationship. There are two measures for the dependency; covariance and Pearson’s correlation coefficient.
correlation VS covariance –
| Correlation | Covariance |
| Measure the strength of the relationship of two variables. | shows how two variables are dependent on each other |
| value lie between +1 to – 1, values are standardized | value lie between +infinity to – infinity, values are not standardized |
| independent on unit | dependent on unit |
| indicate the direction and strength of the relationship of two variables | indicate the direction of the relationship of two variables |
Equations
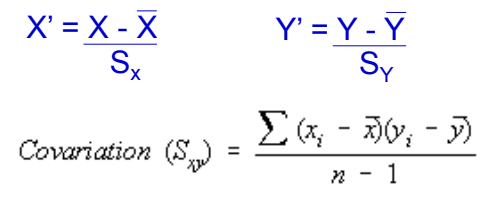

Decision point (critical region)
Decision point is determined by the size of the sample, Tables are available to find the decision points (critical region).
- If r is lies within the critical Accepted the H0
- If r is lies outside the critical region rejected the H0
Pearson’s correlation in R
#Loading the data file to R console
my_data = read.csv("DATA.csv", header = TRUE)

#Test for normality
shapiro.test(my_data$X)

#Calculating covariance
cov (my_data$X, my_data$Y)

#Conducting the correlation analysis
cor.test (my_data$X, my_data$Y, alternative, method, conf.level)

#my_data$X X variable
#my_data$Y Y variable
#alternative = c("two.sided", "less", "greater")
#method Method of correlation calculation
#c("pearson", "kendall", "spearman")
#conf.level=Confidence level