
Multivariate analysis is a statistical methods that perform simultaneous analysis of multiple variables. identify the relationships among variables and identify the patterns and trends of the information.
Types of multivariate analysis
- Factor Analysis
- Principal component analysis
- Cluster analysis
- Discriminant analysis
- Canonical correlation analysis.
Factor Analysis
- Factor analysis is used to identify the factors or dimensions that describe the most of the variations in the set of variables.
- The goal is that reduce the number of variables into underlying factors that describe the most of variations in the data.
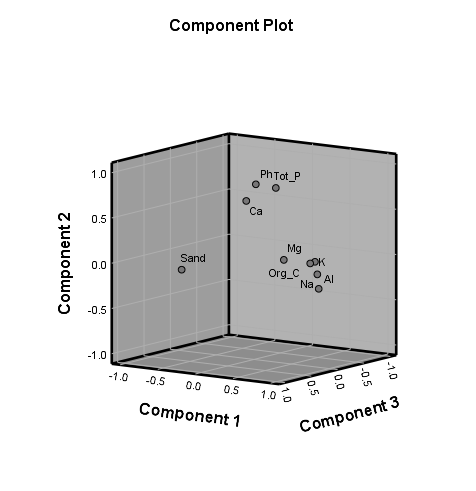
Principal component analysis (PCA)
- PCA reduce the dimensionality of set of data and identify the most important variables (Principle components)’
- PCA makes a new set of variables (Principle components) that explain the most of variations in the data set.
- PCA is considered as a statistical method under factor analysis.
Principal component analysis (PCA) in R studio
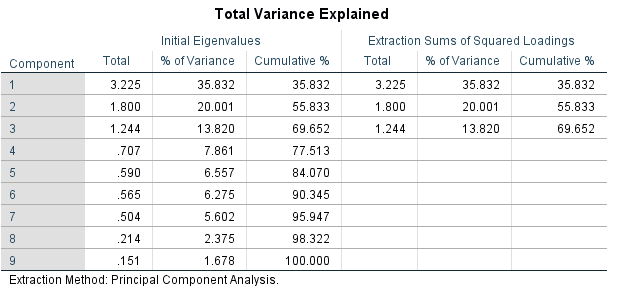
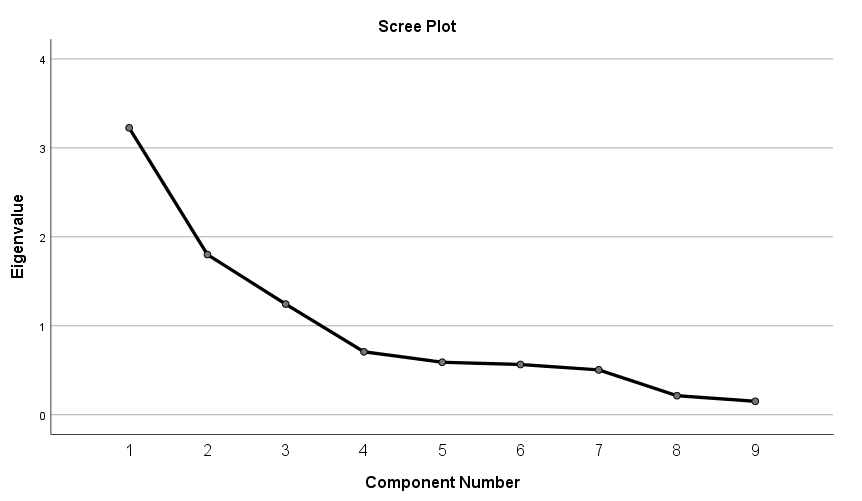
Eigenvalue – measure the amount of variance in the original dataset that by each PC (principal components)
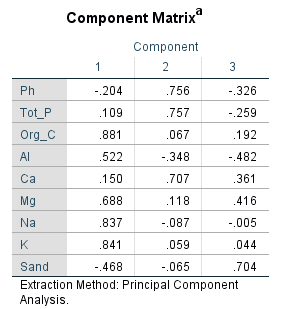
Loading/Eigenvectors in PCA – describe the correlation between the original variable and corresponding PC (principal components)
Factor Analysis VS PCA
- Both methods are data reduction
- PCA extract as much as variance from the data set, make few principle components.
- Factor analysis explain as much as correlation base on the minimum numbers of factors.
- PCA give a unique results
- Factor analysis is multiple results base on the methods.
Limitations of the PCA
- Larger sample size would give better results
- Outliers influence on correlations would bias results
- No hypothesis test, no P values, no decisions.
Cluster analysis
- The main purpose of the cluster analysis is to reduce large data set into meaningful subgroups of individuals or objectives. these clusters are highly internally homogenous and highly externally heterogeneous.
- Datasets that used for MANOVA and PCA usually also suitable for cluster analysis.
- Cluster analysis can be used to cluster the observations and cluster the variables.
Cluster analysis – steps
- Data collection and select the variables
- Generate the similarity matrix.
- Decision about the cluster and interpretation the validation based on the dendrogram.